Optimized Baseline
Traditional HTTP requests are fast, uniform, and cheap. Standard round-robin request scheduling strategies balance this load well.
LLM requests break all three assumptions. They are:
- Multi-turn - conversations and agentic tool loops send the same growing prefix repeatedly
- Slow - a single request can take over a minute generating tokens
- Non-uniform - range from 1000s of reasoning tokens to a 100k+ context tokens
The llm-d Router injects awareness of the LLM-workload into the load-balancing layer considering prefix-cache affinity and server load metrics.
This guide demonstrates one approach to prefix- and load-aware routing. The llm-d Router supports other options as well, including session affinity and active request based routing, which make no assumptions about the router's ability to parse the request or probe the servers. See configuration for more details on the available scorers, or precise prefix cache routing for KV-event-driven scoring.
Deploy
See the optimized baseline guide for manifests and step-by-step deployment.
Architecture
Prefix-Aware Scheduling
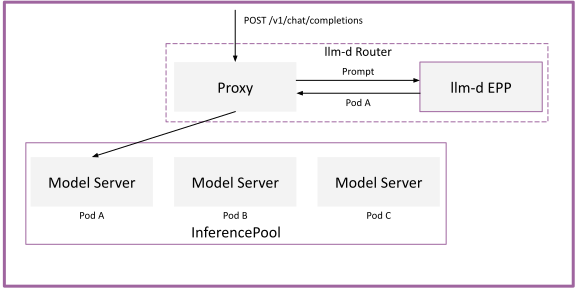
EPP maintains a view of each endpoints' prefix-cache state in memory. When a request arrives, it identifies which pod already holds the matching prefix in KV-cache and routes the request there. For multi-turn workloads, this optimization is critical to avoid excessive recomputation in a scale-out setting.
Load-Aware Scheduling
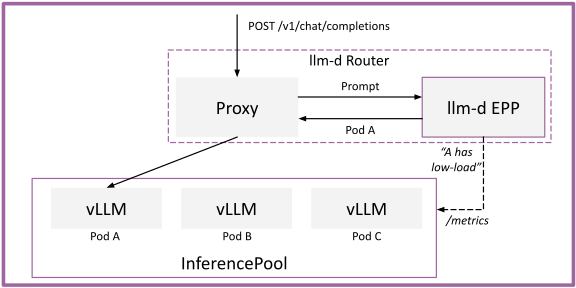
EPP continuously probes each endpoints' metrics by scraping /metrics at a regular interval (50ms default). It scores endpoints on queue depth, running requests, and KV-cache utilization to schedule requests to the endpoint with the lowest load, avoiding hotspots caused by heterogeneous request patterns.
Observability
The optimized baseline balances two routing objectives, prefix-cache affinity and load-aware spread, so the signals that matter are cache hit rate and per-pod load balance watched together. The guide's Observability & Troubleshooting section covers the key metrics for this path and the common failure modes (including the peakPrefillThroughput calibration trap on non-default hardware), backed by the shared PromQL and metric references.
Further Reading
See EPP Architecture for more details.