Sticky Until Saturated: Token-Aware Routing in llm-d


How the llm-d router balances KV-cache affinity against token load
The llm-d router's default configuration has changed to something an operator can reason about, built on a single methodology: token-aware routing. The scheduler prioritizes KV-cache affinity, keeping each request on the endpoint that already holds its prefix, unless the load on that endpoint exceeds a calibrated limit; past the limit it ignores affinity and picks the endpoint by load alone. Load is measured in tokens matched to the workload's bottleneck, giving two configurations: for prefill-bound traffic (long prompts), prefix-cache affinity + token load (prefix-cache-affinity-filter + token-load-scorer), routing on uncached prefill tokens in flight; for decode-bound traffic (long outputs), prefix-cache affinity + active requests (prefix-cache-affinity-filter + active-request-scorer), routing on active streams. We call each pairing of the affinity filter with a load signal a bottleneck-matched configuration (or matched configuration for short).
Two failure modes motivated the change. The first is the previous default itself: a four-signal weighted blend (prefix-cache match, queue depth, KV utilization, LRU) whose emergent behavior was hard to predict and harder to tune. The second is the hot spotting most routers suffer from over-indexing on KV-cache affinity: affinity concentrates traffic on cache-warm endpoints, and without an explicit saturation release the warm endpoint keeps absorbing load past the point where a cold endpoint would serve the request faster. Token-aware routing pairs one signal with one bottleneck and one calibrated limit, so the scheduler is legible: an operator can predict what it will do, why it will do it, and how it will degrade under load.
The results back the change. On the benchmarks below, the matched configurations sustain 2–3× the throughput of Kubernetes Service round-robin on prefill-bound workloads while holding TTFT through the operating range, and hold parity or better everywhere else. The stack now ships as the default across llm-d's optimized-baseline, agentic-serving, multimodal-serving, and P/D-disaggregation guides, and it is running on production serving fleets, including Google Cloud Vertex AI, Red Hat, and Mistral.
This post is the analysis behind that shift. It develops the framework across three workloads spanning the two bottleneck regimes (prefill compute, decode slots), derives the configuration's one threshold in closed form from a single hardware calibration (see Deriving τ from the Hardware), and evaluates the latency-predictor pipeline as a workload-agnostic alternative for operators with high-variance traffic or an uncharacterized bottleneck. The experiments were run against the affinity filter's earlier parameterization; the shipped interface has since been redesigned around the calibration quantity derived here (peakPrefillThroughput, see the saturation override), and the calibration procedure is distributed with the router as a shared recipe with a per-(model, accelerator) configuration matrix.
Setup
Hardware and serving stack. 10× Qwen3-32B (8× for b2b-saas) model servers running vLLM, each with tensor parallelism TP=2 across 2× H100 GPUs on a dedicated GKE node. vLLM is configured with max-num-batched-tokens=8192 and continuous batching. Each model server runs as a Kubernetes pod, fronted by a Gateway API InferencePool resource that routes inference traffic through the router. Throughout, we refer to a model server as an endpoint; in this deployment each endpoint is one pod, but an endpoint may span multiple pods in multi-node deployments.
Router pipeline and plugin configuration. The router composes scheduling decisions from a pipeline of filter and scorer plugins. Filters restrict the candidate endpoint set; scorers assign weighted scores; a picker plugin selects the final destination from the scored candidates. We evaluate five scheduler configurations:
- k8, Kubernetes Service round-robin, bypassing the router entirely. Serves as the no-scheduler baseline.
- token-load-aware,
prefix-cache-affinity-filter(affinityThreshold=0.8,maxTokensInFlightPenalty=286720; the earlier interface's predictor-based TTFT threshold was unused on this arm, no predictor deployed) followed bytoken-load-scorerandmax-score-picker. Under the shipped interface this configuration ispeakPrefillThroughput=20480withmaxTTFTPenaltyMs=14000(see the saturation override for the mapping between the two parameterizations). The matched configuration for prefill-bound workloads. We refer tomaxTokensInFlightPenaltyas τ throughout this post. The token-load scorer uses a lookahead formulation:score(endpoint) = current_uncached_in_flight(endpoint) + prompt_tokens × (1 - hit_rate(endpoint)), where the second term is the marginal uncached work this request would add on each candidate. Streaming is enabled for all workloads; with the in-flight load producer's default configuration (addEstimatedOutputTokens=false), a request's tokens are released as soon as the first streamed chunk arrives, so the in-flight counter tracks only tokens yet to be prefilled. The producer can instead be configured (addEstimatedOutputTokens=true) to also hold an output estimate,round(inputTokens × outputRatio)(default ratio 1.5, bounded by the client's output cap and an optional operator cap), until the response completes, approximating tokens held in KV cache. - active-request-aware,
prefix-cache-affinity-filter(sameaffinityThreshold=0.8andmaxTokensInFlightPenalty=286720saturation override as the token-load-aware configuration) followed byactive-request-scorerandmax-score-picker. The matched configuration for decode-bound workloads. The affinity filter is included structurally but is a no-op when shared-prefix content is too small to clear the 0.8 threshold; on reasoning's 250-token shared system prompt the filter passes all candidates through and the downstream scorer operates on the full set. - legacy blend, the heuristic multi-signal weighted blend shipped as the router default at the time these experiments were run (since superseded as the default by the prefix+token matched configuration):
prefix-cache-scorer (weight=3) + queue-scorer (weight=2) + kv-cache-utilization-scorer (weight=2) + no-hit-lru-scorer (weight=2), withmax-score-picker. No affinity filter, prefix locality is enforced by the prefix-cache-scorer's weight in the blend. - latency-predictor,
prefix-cache-affinity-filter (maxTTFTPenaltyMs=5000, maxTokensInFlightPenalty=0) + latency-scorer, withweighted-random-picker. The workload-agnostic pipeline, with predictor training and prediction sidecars deployed alongside each model server.
All configurations using the affinity filter use the same affinityThreshold=0.8 and explorationProbability=0. Full configmaps are in the appendix.
Workloads. Three workloads are used:
- code-generation (prefill-bound): conversation-replay workload from the
inference-perfworkload catalog. Per-conversation system prompts 3000–100000 tokens (mean ~55000), 2–20 turns per conversation (mean 6), 100–10000 input tokens per turn (mean 1500), 50–4000 output tokens per turn (mean 800). Concurrency swept from 10 to 100. - reasoning (decode-bound): reasoning workload from the
inference-perfworkload catalog. 250-token shared system prompt, 1000-token user prompt, 8000-token mean output (max 32000). Each run generatesnum_conversations = concurrency_levelsingle-turn conversations (each pairs a unique user prompt with the same shared system prompt) and issues3 × concurrency_levelrequests, so each conversation is issued roughly three times over the run. The repetition ensures the workload exercises steady-state load balancing rather than being dominated by the initial arrival burst. Concurrency swept from 50 to 450. - b2b-saas (prefill-bound, pathological): the shared-prefix workload used by the llm-d optimized-baseline benchmark guide and analyzed in the llm-d "KV-cache wins you can see" blog post. 150 distinct 6000-token system prompts × 5 question variants, 1200-token questions, 1000-token outputs. Shared-prefix sampling under Poisson arrival, QPS ramped from 3 to 60. The same 750-prompt corpus cycles through the cluster repeatedly, making this a stress test of the matched configuration's cache-management behavior rather than a representative traffic shape. See the b2b-saas caveat for the framing.
Full workload YAML specifications are in the appendix.
Load generation and metrics. Load is generated by inference-perf. Per-stage metrics (TTFT, TPOT, end-to-end latency, throughput, success rate, queue depth, KV utilization, prefix cache hit rate) are exported to Google Cloud Storage as JSON and aggregated for analysis. Each (workload, configuration, concurrency level) combination is run once; we report achieved values rather than confidence intervals.
Main Result
Identify the workload's bottleneck, deploy the matched configuration:
| Bottleneck | Workload signature | Configuration | Notes |
|---|---|---|---|
| Prefill compute | Long prompts (relative to outputs), enough volume that aggregate prompt processing strains per-endpoint prefill throughput | prefix-cache-affinity-filter (calibrated peakPrefillThroughput, maxTTFTPenaltyMs = T_max) + token-load-scorer + max-score-picker | Same matched configuration covers both typical prefill-bound workloads (code-generation) and pathological cases where the same small corpus repeats (b2b-saas). The gate encodes τ = peakPrefillThroughput × maxTTFTPenaltyMs (see the derivation); our runs correspond to 20480 tok/s × 14s = 286720. maxTTFTPenaltyMs must be nonzero, it is the saturation release; 0 would never break stickiness. |
| Decode slots | Short prompts, long outputs, decode batch capacity is the binding constraint | prefix-cache-affinity-filter (calibrated peakPrefillThroughput, maxTTFTPenaltyMs = T_max) + active-request-scorer + max-score-picker | Affinity filter is included structurally but acts as a no-op when shared-prefix content is too small to clear affinityThreshold=0.8. |
| Mixed / unknown / high-variance | Heterogeneous traffic shapes; production workloads with shifting bottlenecks | prefix-cache-affinity-filter (ttftSource=latencyPredictor, maxTTFTPenaltyMs=5000) + latency-scorer + weighted-random-picker | Outperforms k8 on all workloads evaluated here. Adds setup overhead (predictor training, sidecar deployment), prefer a matched configuration when the workload is well-understood. Plausibly the best choice for high-variance production workloads where the bottleneck shifts dynamically, though this is untested here. |
The threshold τ in the affinity filter should be derived from one hardware calibration measurement per (model, accelerator), see the derivation. On Qwen3-32B / H100 with max-num-batched-tokens=8192 and a TTFT degradation tolerance of 14s, this produces τ = 286720 (= 35 × 8192, or 35 max-num-batched-tokens chunks of pending uncached prefill work).
The prefix+token configuration is the bottleneck-matched choice for prefill-bound workloads and also serves as a strong default across regimes; it is now the configuration the optimized-baseline guide ships as the llm-d default. For decode-bound workloads specifically (where active-stream count is the binding signal), the active-request-scorer configuration provides a small additional improvement at the operating range knee. For mixed workloads where the bottleneck shifts dynamically, the latency-predictor pipeline is the safer default at the cost of additional setup overhead.
A note on the heuristic weighted blend (legacy blend): a carefully tuned weight set will outperform a general configuration on the specific workload it was tuned for. The blend's weights (prefix=3, queue=2, kv=2, lru=2) reflect optimization for repeated-corpus chat-completion-shaped traffic and deliver the lowest TTFT-p90 on b2b-saas (results below). The matched configurations are not claimed to beat a bespoke weight set on the workload it was designed for; they are claimed to be predictable across workloads, derivable from one calibration measurement, and competitive across the load curve in each regime. The trade-off is best-case performance on one workload vs. legibility and portability across many.
Results presents the evidence. The Prefix-Cache-Affinity Filter develops the architectural argument for the affinity filter. Deriving τ from the Hardware derives τ from hardware calibration.
Three Workloads, Two Bottlenecks
The central claim of this work is that LLM inference scheduling benefits from a different organizing principle than weight-tuning a multi-signal scorer: identify what's limiting throughput on the target workload, then deploy a scheduler configuration whose signal matches that limit. This section establishes the taxonomy.
The Two Regimes
A request through vLLM consists of two phases with different resource profiles. Prefill processes the prompt in chunks of max-num-batched-tokens (8192 in our setup), bounded by GPU compute throughput and per-chunk attention cost. Decode generates output tokens one at a time across a batch of concurrent requests, bounded by KV-cache memory and the number of available decode slots. Which phase saturates first depends on the workload's shape, specifically, the ratio of prompt tokens to output tokens.
We identify two regimes:
Prefill-bound (compute-limited). The bottleneck is per-endpoint prefill throughput. Prompts are long enough that filling max-num-batched-tokens consumes nontrivial time per iteration, and aggregate prompt volume exceeds the cluster's ability to keep up if requests are distributed poorly. Decode batches fill quickly but spend most of their iteration time on prefill chunks rather than decode steps. The right scheduler signal is uncached prefill tokens currently in flight per endpoint, routing new prompts to the endpoint with the lowest in-flight uncached-token count maximizes effective prefill throughput. Code-generation (mean ~70k token prompts, mean 800 output tokens) and b2b-saas (7200-token prompts, 1000-token outputs, fixed 750-prompt corpus) are both prefill-bound. They differ in cache-management dynamics, see the b2b-saas caveat.
Decode-bound (slot-limited). The bottleneck is the number of concurrent decode streams a endpoint can sustain. Prompts are short, outputs are long, prefill completes quickly, and the cluster spends most of its time generating output tokens. KV-cache pressure builds with concurrent requests, not with per-request size. The right scheduler signal is running request count per endpoint, sending new work to the endpoint with the fewest active streams keeps decode batches uniformly loaded. An alternative token-denominated signal is tokens in process: the in-flight load producer tracks tokens yet to be prefilled, and can be configured (addEstimatedOutputTokens=true) to also hold a ratio-based output estimate until the response completes, approximating KV-cache occupancy. Once a request is past prefill, its actual tokens in KV cache could in principle be tracked as the decode-load signal, from the router's event-driven KV-block index rather than the engine's polled KV-usage metric, which lags dispatch. In practice the simple active-request count works well, and it is the form we benchmark here. Reasoning (mean 1000 token prompts, mean 8000 output tokens) is our representative.
The regimes are not always disjoint, a real workload may sit between them or shift between them as load changes, but they cover the dominant cases the router encounters in practice. The taxonomy is useful precisely because the matched configuration for each is different.
The B2B-SaaS Caveat
B2B-SaaS deserves explicit framing before we present results. Unlike code-generation and reasoning, which approximate realistic traffic shapes, b2b-saas is a stress test on a fixed, small corpus: 150 distinct system prompts × 5 question variants, sampled randomly. The same 750-prompt set cycles through the cluster repeatedly. With aggregate cacheable content (~900k tokens) exceeding the cluster's per-endpoint KV capacity (~200–300k tokens per endpoint × 8 endpoints, with substantial overlap if prefixes are replicated), the workload is engineered to make cache distribution the dominant secondary factor on top of prefill compute.
This produces two characteristics that distinguish b2b-saas from code-generation despite both being prefill-bound:
- The cluster settles into one of two distinct steady states depending on τ. Either it converges to a stable partition (each endpoint owns a subset of prefixes, hit rate stays high) or it cascades into eviction churn (every endpoint tries to cache every prefix, hit rate collapses). There's no smooth in-between, small changes in τ can flip the cluster from one state to the other.
- Steady-state behavior depends on how prompts seed across endpoints during the ramp. Because the same 150 prefixes repeat, the partition that forms in the first few ramp stages persists for the rest of the run. Two runs of the same configuration can converge to different partitions and produce different absolute numbers, even though the relative ranking of configurations is stable.
These properties make b2b-saas an excellent benchmark for cache-management mechanisms and a poor benchmark for hyperparameter sweeps. We use it specifically to demonstrate (a) that token-load-aware routing beats round-robin by 2–2.5× on workloads with heavy prefix reuse, and (b) that the τ=286720 threshold (= 35 × 8192) in prefix-cache-affinity-filter functions as a saturation valve, validated empirically by the failure modes of smaller τ values. We do not use it to claim a precise optimal τ; the bimodality means such a claim wouldn't generalize even within b2b-saas, let alone across workloads. The matched configuration for prefill-bound regimes is structural; the tuning is derived from the τ_sat formula in the derivation rather than from b2b-saas sweeps.
Primary Metrics
In what follows we focus on TTFT-p90 and input tokens per second for the prefill-bound workloads (code-gen and b2b-saas), and TPOT-p90 and output tokens per second for the decode-bound workload (reasoning). These are the metrics that reflect whether each workload's bottleneck is being managed well; other metrics are reported in the appendix but are not load-bearing in the analysis.
Results
Code-Generation (Prefill-Bound)
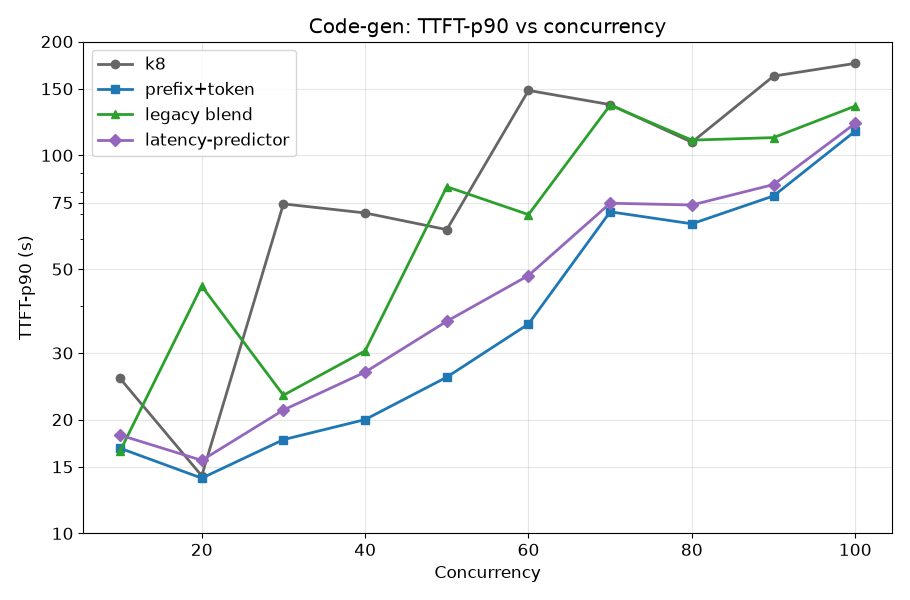
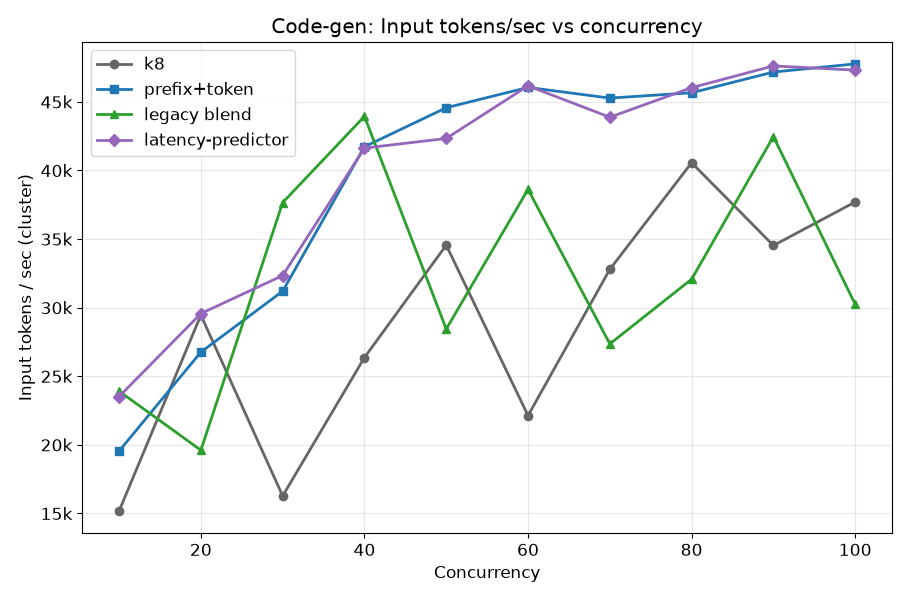
Long prompts (mean 70k tokens, growing across conversation turns), moderate outputs (mean 800), no cross-request prefix overlap. Per-endpoint prefill compute is the binding constraint. Matched configuration: prefix-cache-affinity-filter (τ=286720, equivalently 35 × B = 35 chunks) + token-load-scorer + max-score-picker. Lookahead scoring: score(endpoint) = current_uncached_in_flight + prompt_tokens × (1 - hit_rate(endpoint)).
TTFT-p90 and input tokens per second
Prefix cache hit rate
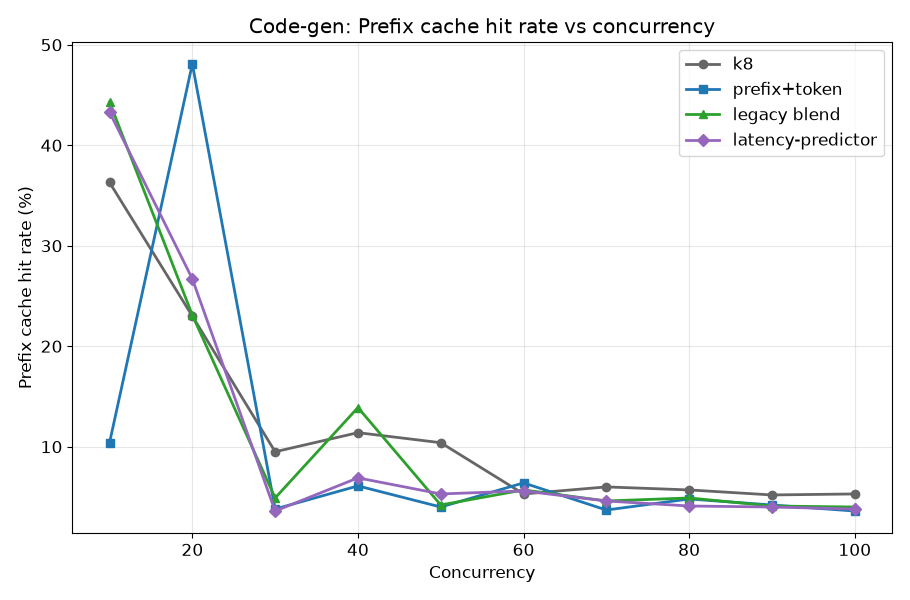
Per-conversation prompts are unique, so cache hits only come from within-conversation turn continuity. Each concurrency point is an independent run (the cluster is not warmed across runs), so the conc=10 column is noisy because the run has only ~60 total requests (10 conversations × ~6 turns) and absolute hit-rate values at this volume are dominated by which endpoints individual conversations happen to land on. At conc=20 prefix+token achieves the highest sustained hit rate (48%), consistent with the affinity filter preserving turn-to-turn locality where the soft-affinity (latency-predictor) and no-affinity (legacy blend, which relies on the prefix-cache-scorer's weight in its blend instead) configurations do not. At high concurrency cache hit rate collapses across all configurations because per-endpoint KV capacity is exhausted by the diversity of active conversations, but the prefill-throughput advantage above persists, suggesting the filter is doing useful work even when the steady-state hit rate metric is low.
Summary
Across the full load curve prefix+token has the lowest TTFT-p90 and highest input tokens per second. Through conc=60 TTFT-p90 stays below 40s; throughput plateaus at ~47k in_t/s by conc=60 and holds. latency-predictor tracks prefix+token within ~10s of TTFT across the curve. k8 and the legacy blend exhibit cliff failures in multiple concurrency points and are not viable for sustained operation.
Reasoning (Decode-Bound)
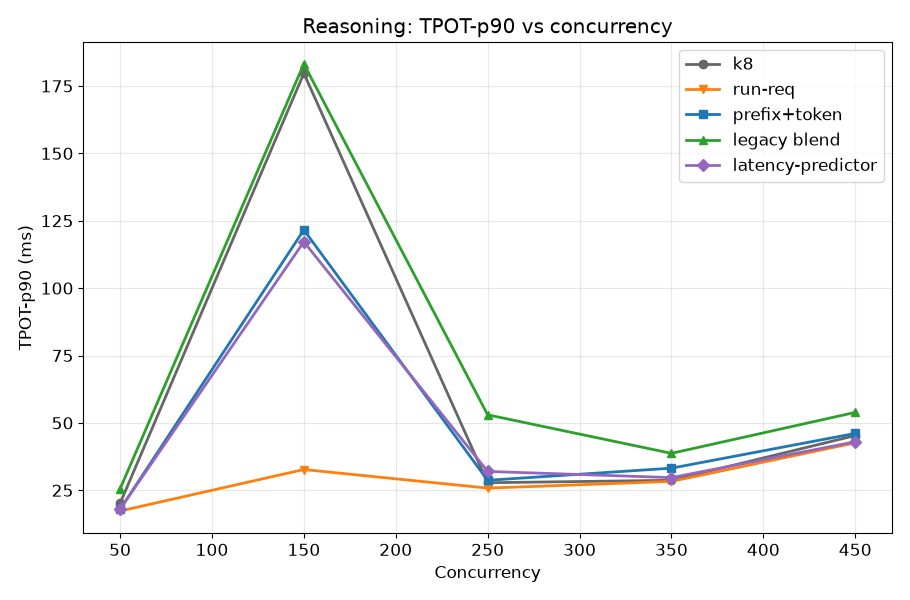
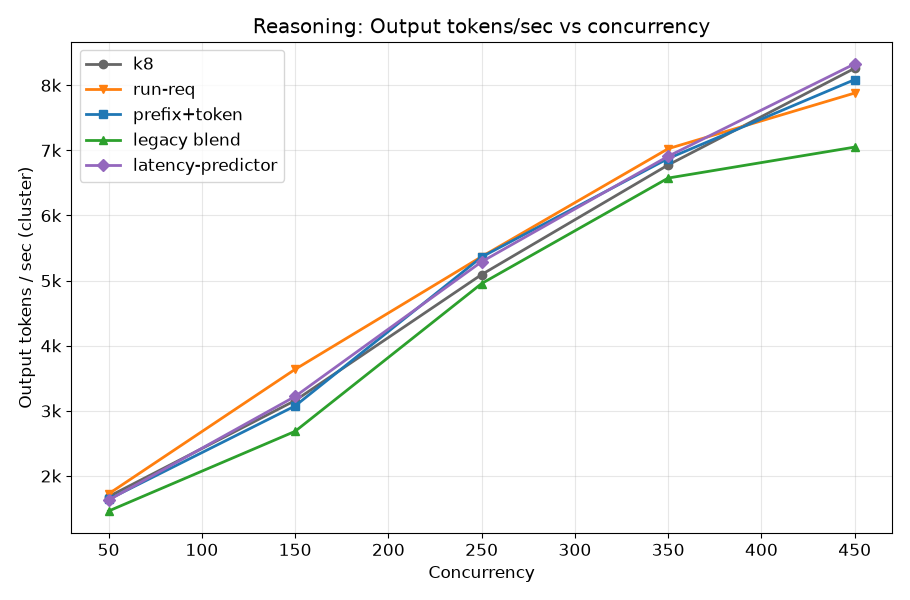
Short prompts (mean 1000 tokens), long outputs (mean 8000, max 32k), 250-token shared system prompt. Each run has num_conversations = conc single-turn conversations, each issued roughly three times (total 3 × conc requests). Decode-slot pressure is the binding constraint at all concurrency levels above ~150. Matched configuration: prefix-cache-affinity-filter + active-request-scorer + max-score-picker (the "run-req" configuration). The affinity filter is included but acts as a no-op in practice: a conversation's first issue can only match the 250-token shared prompt (0.25 affinity at best against the ~1000-token user prompt), and observed hit rates stay below the 0.8 threshold throughout (see the hit-rate data below), so the filter passes all endpoints through. We also include the workload-agnostic prefix+token configuration for comparison; it is competitive here but does not exceed run-req on the decode-slot signal.
TPOT-p90 and output tokens per second
Prefix cache hit rate
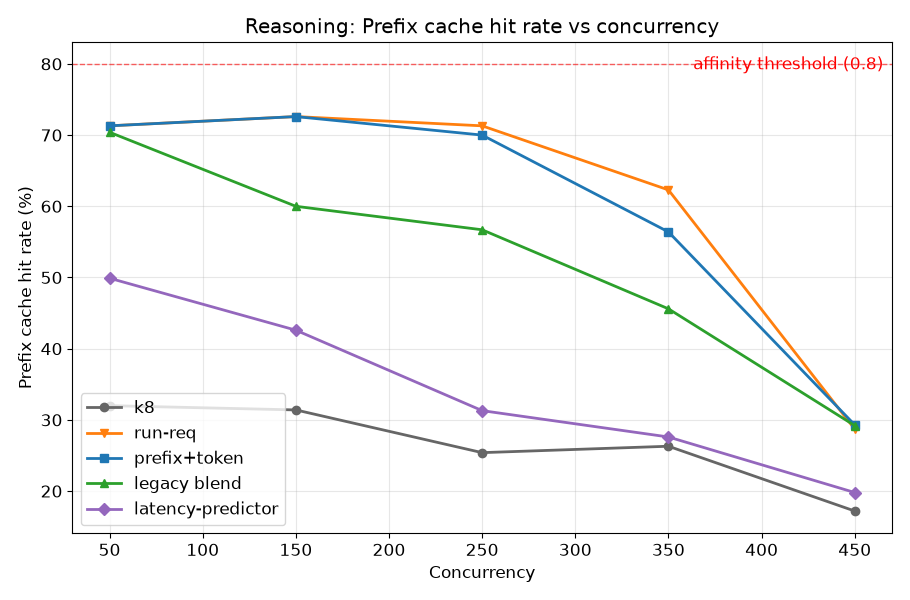
Hit rates never reach the 0.8 affinity-filter threshold: a conversation's first issue can only hit on the 250-token shared prompt (0.25 affinity at best), and although repeated issues of the same conversation are fully cacheable in principle, observed rates never clear the threshold. run-req and prefix+token both achieve high hit rates through the operating range because their schedulers do not actively scatter requests (run-req minimizes stream count per endpoint, which preserves locality as a side effect; prefix+token's filter is inactive but the downstream token-load-scorer also preserves locality through low-load preference). The legacy blend creates more scatter, and latency-predictor's weighted-random sampling actively spreads requests.
Summary
Overall run-req has the lowest TPOT-p90 and the highest output tokens per second. prefix+token is competitive but does not improve over run-req. Latency-predictor matches run-req at saturation. The legacy blend's prefix-weighted scoring creates hotspots that hurt at every concurrency above 50.
B2B-SaaS (Pathological Prefill-Bound)
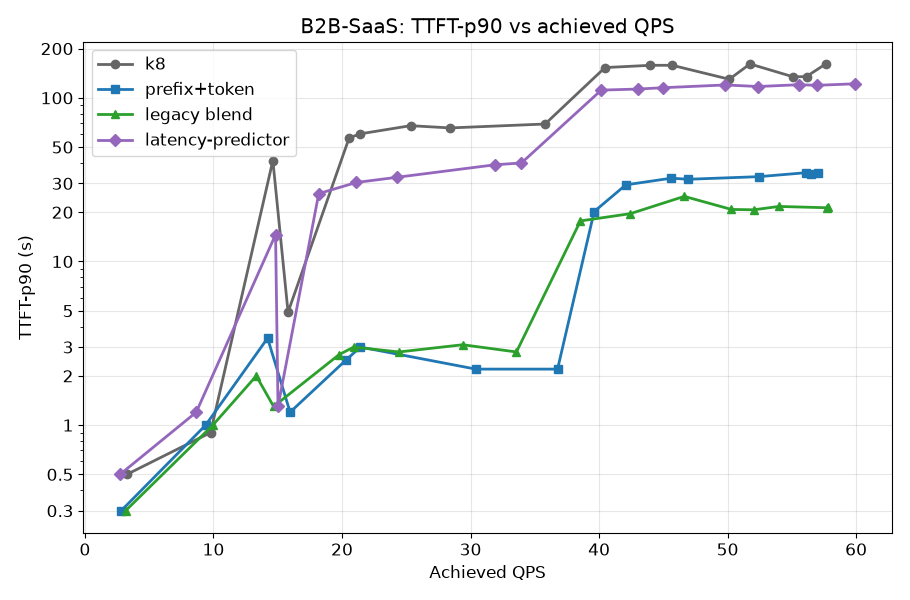
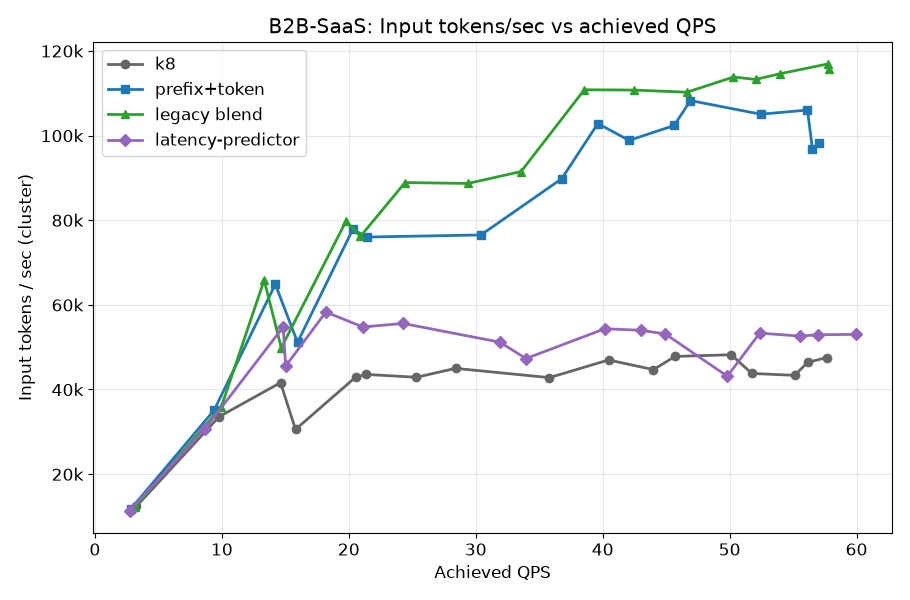
Synthetic stress workload: 150 distinct system prompts × 5 question variants, sampled randomly under Poisson arrival ramped from 3 → 60 QPS. 7200-token prompts (6000-token system + 1200-token question), 1000-token outputs, streaming. Aggregate cacheable content (~900k tokens) exceeds aggregate per-endpoint KV capacity if prefixes are replicated rather than partitioned. Matched configuration: prefix-cache-affinity-filter (τ=286720, hard) + token-load-scorer + max-score-picker. See the b2b-saas caveat on b2b-saas as a stress test.
TTFT-p90 and input tokens per second
Prefix cache hit rate
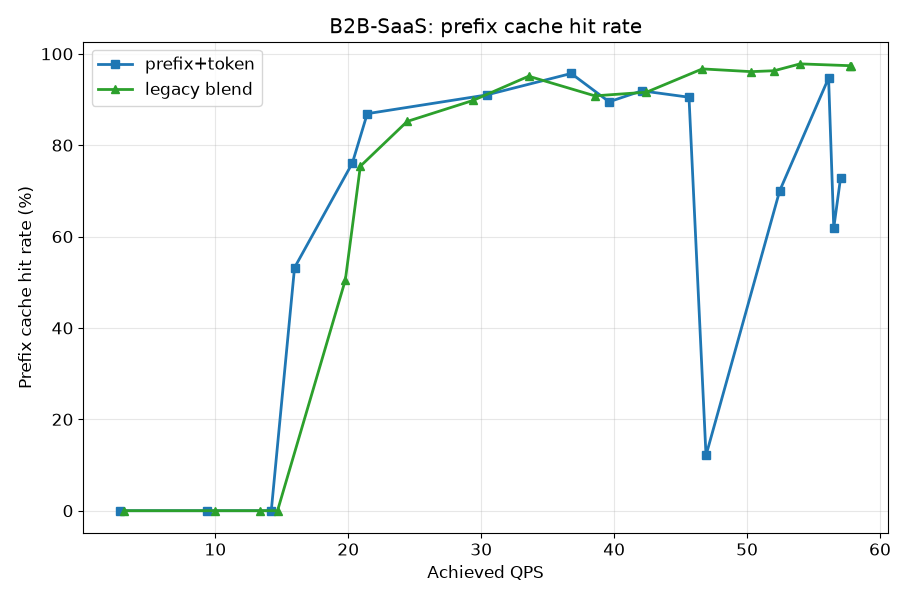
Both prefix+token and the legacy blend sustain high hit rates (~90–95%) once load ramps past QPS ~20. This is the cluster's prefix partition holding: each endpoint owns a subset of the 150 prefixes and serves repeated requests for that subset locally. Both configurations preserve the partition through the operating range, which is why both deliver the prefill-throughput advantage seen above. They preserve it through different mechanisms, though: prefix+token uses the prefix-cache-affinity-filter to restrict candidates to warm endpoints, then token-load-scorer + max-score-picker to pick among them. The legacy blend has no affinity filter (see Setup); its prefix locality is enforced by giving prefix-cache-scorer the largest weight (3) in the blend, which causes max-score-picker to almost always pick the endpoint with the highest prefix match. The two are mechanically different but produce similar steady-state behavior in this workload because both end up routing to the cache-warm endpoint most of the time. At very high QPS (50+) prefix+token's hit rate drops to 70–73% while the legacy blend holds at 96–97%; this reflects the τ=286720 saturation valve engaging on prefix+token when warm endpoints accumulate enough uncached in-flight tokens to trigger the override, briefly redistributing traffic away from warm endpoints. The legacy blend has no such valve.
Summary
Overall prefix+token (τ=286720) and the legacy blend both sustain useful TTFT and high prefill throughput. k8 cannot reach this range. latency-predictor cannot either. Beyond the operating range, the legacy blend's bespoke-tuned weights give it a slight TTFT advantage. The derivation below produces τ=286720 from one calibration measurement and an SLO ceiling, eliminating the need to tune τ empirically per workload.
Cross-Workload Summary
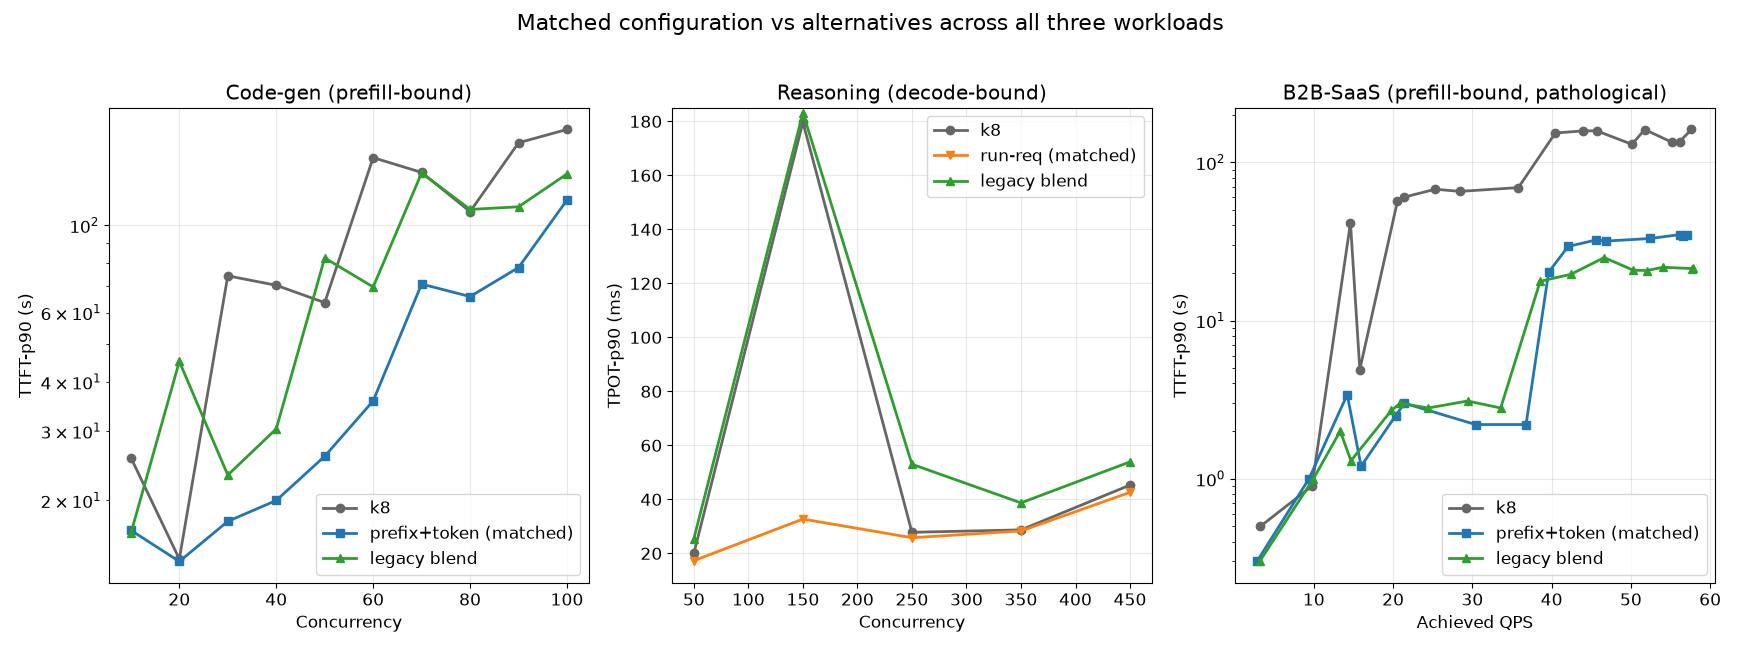
Three workloads, two bottlenecks, two matched configurations. The pattern across the three workloads is consistent: the configuration whose signal matches the workload's bottleneck wins through the stable operating range, while alternatives either knee earlier, exhibit cliff failure modes, or both. No single configuration wins across all three workloads, but the choice of which to deploy is fully determined by identifying the bottleneck.
| Workload | Bottleneck | Matched configuration | Knee position (matched) | Knee position (k8) | Throughput at knee (matched vs k8) |
|---|---|---|---|---|---|
| code-generation | prefill compute | prefix-cache-affinity (τ=286720) + token-load + max-score | conc=60 | conc=30 | 46k vs 16k in_t/s (2.9×) |
| reasoning | decode slots | prefix-cache-affinity (τ=286720) + active-request-scorer + max-score | conc=350 | conc=250 | 7.0k vs 6.8k out_t/s (~parity) |
| b2b-saas | prefill compute (pathological cache dynamics) | prefix-cache-affinity (τ=286720) + token-load + max-score | QPS=38 | QPS=18 | 90k vs 45k in_t/s (2.0×) |
The Prefix-Cache-Affinity Filter
The filter restricts the candidate set passed to the downstream scorer. Each endpoint is assigned an affinity score (fraction of incoming prompt tokens already cached on that endpoint); endpoints with affinity ≥ affinityThreshold (0.8 in our setup) form the candidate set. If no endpoint meets the threshold, all endpoints pass through and the downstream scorer operates on the full set.
Composability Across Regimes
The filter is present with the same affinityThreshold=0.8 in all three matched configurations. The downstream scorer changes; the filter does not.
- Prefill-bound, typical (code-gen): filter restricts to cache-warm endpoints (affinity > 0.8 when turn-to-turn cache continuity exists) →
token-load-scorerpicks the warm endpoint with fewest uncached tokens in flight - Prefill-bound, pathological (b2b-saas): filter restricts to cache-warm endpoints (affinity > 0.8 from the system-prompt portion of the prompt) →
token-load-scorerpicks the warm endpoint with fewest uncached tokens in flight - Decode-bound (reasoning): affinity scores stay below 0.8 (the 250-token shared prompt against a 1000-token user prompt gives 0.25 affinity at best on a conversation's first issue, and observed hit rates stay below the threshold on repeats) → filter passes all endpoints through →
active-request-scorerpicks the endpoint with fewest active streams, as if filter weren't present
One filter, one threshold, three matched configurations, no per-workload reconfiguration.
The Saturation Override
The filter allows non-warm endpoints back into the candidate set when staying with the warm set would be harmful. In the interface our experiments ran against, this override was expressed as two alternative thresholds:
maxTokensInFlightPenalty(τ): a non-warm endpoint is added back to the candidate set if its uncached-tokens-in-flight count is at least τ lower than the warm endpoint's. This is the saturation guard used by the matched configurations (τ=286720), and engages only when the warm endpoint is genuinely compute-saturated. The earlier interface's predictor-based threshold (next bullet) requires latency-predictor sidecars and was inert on these arms.maxTTFTPenaltyMs: a non-warm endpoint is added back to the candidate set if its predicted TTFT is within the budget (in milliseconds) of the best warm endpoint's predicted TTFT. Requires the latency-predictor to produce TTFT estimates. Used by the latency-predictor pipeline (maxTokensInFlightPenalty=0,maxTTFTPenaltyMs=5000); see below.
The filter on llm-d main unifies these into a single time-domain gate. Every endpoint's TTFT is estimated, either from peakPrefillThroughput (in_flight_tokens / R_peak, the default) or from the latency predictor, selected by ttftSource, and stickiness breaks when the best warm endpoint's estimated TTFT exceeds the best non-warm endpoint's by more than maxTTFTPenaltyMs. With the throughput source, this is exactly the token-gap condition above: the gate fires when the in-flight gap exceeds τ = R_peak × T_max, computed internally. The shipped defaults (peakPrefillThroughput=15928, maxTTFTPenaltyMs=18000) reproduce our threshold: 15928 × 18s = 286,704 ≈ 286720. The next section derives this quantity from hardware calibration; under the current interface, the calibration measurement is the configuration parameter.
Latency-Predictor's Threshold Configuration
The latency-predictor pipeline sets maxTTFTPenaltyMs=5000 and uses weighted-random sampling among the candidates the filter produces. This combination has empirically worked well on the workloads where the predictor is appropriate (code-gen and reasoning). The 5s value can be raised if observed TTFT regressions warrant a tighter override; we have not characterized the sensitivity systematically. In the current filter interface this configuration corresponds to ttftSource: latencyPredictor with maxTTFTPenaltyMs=5000.
Deriving τ from the Hardware
The 286720 threshold (= 35 × 8192, or 35 max-num-batched-tokens chunks) appears in our matched configurations without justification above. This section derives it from a single calibration measurement and an operator-chosen SLO ceiling, and shows the formula generalizes across (model, accelerator) combinations.
This derivation is no longer only an operator recipe: the filter on llm-d main implements it internally, taking peakPrefillThroughput (R_peak) as its calibrated parameter and maxTTFTPenaltyMs (T_max) as the SLO ceiling (see the saturation override). The calibration measurement itself ships as guides/recipes/router/calibration (calibrate.sh reports peakPrefillThroughput = CHUNK_SIZE / median(TTFT), exactly B / T(B) below), with measured reference values per (model, accelerator, engine) in the configuration matrix.
What τ Represents and When It Should Fire
τ is the gap in uncached tokens in flight at which we let a request bypass the warm endpoint for a colder one. Because vLLM batches prefill in chunks of max-num-batched-tokens per iteration rather than processing tokens serially, the cost of staying sticky is bounded by per-chunk throughput, not per-token throughput. τ is therefore best expressed in units of chunks: how many max-num-batched-tokens worth of pending uncached prefill work the warm endpoint is allowed to accumulate as a lead over the coldest endpoint before the override fires. The threshold should fire only when the warm endpoint is genuinely compute-saturated, i.e., when keeping a new arrival on it would cause that arrival's TTFT to exceed an operator-chosen SLO ceiling. Below saturation, stickiness is essentially free (the warm endpoint processes new chunks alongside ongoing work); at saturation, stickiness becomes harmful because the new arrival queues behind work the cold endpoint could do faster.
Deriving τ_sat
The peak prefill throughput per endpoint is set by how fast vLLM processes one fully-packed chunk:
R_peak = B / T(B)
where B = max-num-batched-tokens (the value configured in your vLLM deployment, 8192 in our setup per Setup, but operator-tunable in general) and T(B) is the measured wall-clock time to prefill one chunk of B tokens on the target hardware. This is one calibration measurement.
At saturation, in-flight uncached tokens drain at rate R_peak. A new arrival's queueing time is approximately τ / R_peak, where τ is the warm endpoint's lead in uncached-tokens-in-flight over the coldest endpoint (the quantity the affinity filter's override is configured to fire on, see Setup). For this queueing time to stay within an operator-chosen TTFT degradation ceiling T_max:
τ_sat = R_peak × T_max = (B × T_max) / T(B)
The threshold depends on one measured quantity (T(B)) and one operator-chosen quantity (T_max). Nothing else.
Calibration for Qwen3-32B / H100
We measured TTFT for single requests at prompt sizes P = k × 8192 for k = 1..19:
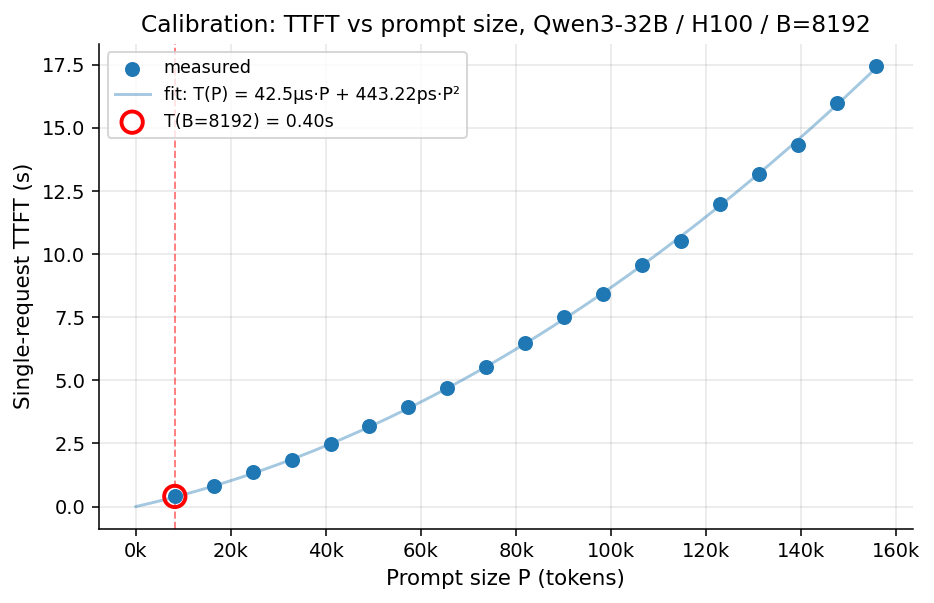
T(B = 8192) = 0.40 s, giving R_peak = 20480 tokens/sec per endpoint.
(The shipped calibration recipe reports peakPrefillThroughput = 15928 for the same nominal path (Qwen3-32B / H100 / TP=2 / B=8192), lower than our 20480 due to methodological differences: the recipe takes the median TTFT of repeated random-token requests through the full request path, where our value comes from a single-request quadratic fit. The two decompositions agree on the quantity that matters, the override threshold: 15928 × 18s and 20480 × 14s both give τ ≈ 286.7k.)
For T_max values:
| T_max | τ_sat |
|---|---|
| 10s | 205k |
| 14s | 286,720 |
| 18s | 369k |
| 25s | 512k |
286720 corresponds to T_max = 14s, i.e., "the threshold fires when keeping a sticky request would cause new arrivals to queue ~14 seconds of prefill work." Equivalently, since τ = K × B for some integer K and T_max = K × T(B), the threshold can be expressed in chunks: τ = 35 × B = 35 max-num-batched-tokens chunks of pending uncached prefill work, equivalent to ~14 seconds of queueing at peak chunk throughput (35 × 0.40s). The chunk-count framing is invariant across hardware: any (model, accelerator) combination with the same K=35 choice produces a threshold corresponding to the same multiple of single-chunk wall time. This matches the empirical observation in the b2b-saas results that the override begins firing around QPS 50+, where TTFT-p90 is approaching the 30s range and the cluster is near compute saturation.
Portability Across (Model, Accelerator, Engine)
The formula requires one calibration run per (model, accelerator, engine) combination. R_peak captures everything specific to the serving path, compute throughput, attention efficiency, kernel quality, framework overhead, in a single number.
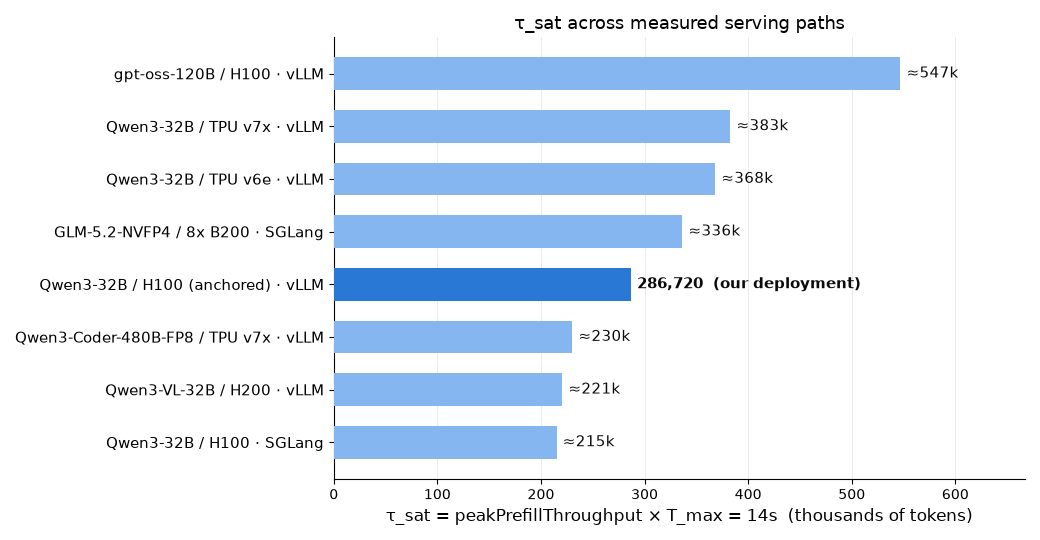
Every row below is measured; none are estimates. The anchored row is our single-request fit from the calibration above (20,480 tok/s). The GLM-5.2 row was calibrated on a production Vertex AI serving fleet (SGLang with EAGLE speculative decoding, 8× B200 per pod, TP=8): ten ~32k-token cache-miss prefills through the full gateway path, median TTFT 1.369s, giving 24,027 tok/s per pod. The remaining rows are the measured peakPrefillThroughput values distributed with the router in the configuration matrix, plus the agentic-serving guide's TPU v7x calibration. Recipe-measured values read lower than a single-request fit of the same path (15,928 vs our 20,480 on the reference H100 path, reconciled above), so τ derived from them is conservative. Each value holds at the chunk size, TP, and quantization its deployment runs (the matrix paths use max-num-batched-tokens=8192; the GLM-5.2 fleet runs a 32k chunk): re-measure after changing any of them.
The spread makes the section's point sharper than any estimate could: R_peak is a property of the full serving path, not of the accelerator. gpt-oss-120B posts the highest value in the table at TP=1 despite being the largest model listed, because it is a sparse MoE (~5B active parameters, MXFP4) and a prefill step touches few weights; on identical H100 hardware it clears ~2.5× the dense Qwen3-32B path. Architecture, engine, sparsity, and quantization all move the number, which is why the matrix keys rows on (model, accelerator, engine) and why one calibration Job beats an estimate whenever the hardware is available. (The SGLang / H100 row corrects the value currently published in the matrix, 30,720, which is 2× too high.) (For hardware that cannot be measured yet, a FLOPs-based estimate can seed a starting value; portability_script/portability.py includes the model we used before these measurements existed.)
| Path | Engine | TP | peakPrefillThroughput (tok/s) | τ_sat at T_max=14s |
|---|---|---|---|---|
| gpt-oss-120B / H100 | vLLM | 1 | 39,065 | ~547,000 |
| Qwen3-32B / TPU v7x | vLLM | 8 | 27,336 | ~383,000 |
| Qwen3-32B / TPU v6e | vLLM | 8 | 26,290 | ~368,000 |
| GLM-5.2-NVFP4 / 8× B200 | SGLang | 8 | 24,027 | ~336,000 |
| Qwen3-32B / H100 (anchored) | vLLM | 2 | 20,480 | 286,720 |
| Qwen3-Coder-480B-FP8 / TPU v7x | vLLM | 8 | 16,444 | ~230,000 |
| Qwen3-VL-32B / H200 | vLLM | 2 | 15,751 | ~221,000 |
| Qwen3-32B / H100 | SGLang | 2 | 15,360 | ~215,000 |
Why τ Does Not Transplant
The table explains why a single τ value cannot transplant across deployments, even deployments sharing hardware. On the same H100, moving our 286,720 onto the gpt-oss-120B path would set the threshold ~1.9× too low: that path drains ~547,000 tokens within the same 14s budget, so the valve would fire while the warm endpoint still had headroom, giving up cache affinity too early. Moving it onto the Qwen3-VL-32B / H200 path would set it ~1.3× too high: that endpoint saturates near 221,000 tokens of in-flight work, so the valve would engage late and new arrivals would queue past the SLO ceiling. The same reversal appears within one accelerator family: TPU v7x supports τ = 383,000 serving Qwen3-32B but only 230,000 serving Qwen3-Coder-480B.
Recommendations
- Calibrate per (model, accelerator, engine,
max-num-batched-tokens) combination by measuringT(B). Check the shipped configuration matrix first, your combination may already be measured; otherwise runcalibrate.shagainst your deployed stack and set the reported value aspeakPrefillThroughputon the filter. - Choose
T_max(maxTTFTPenaltyMs) based on operator TTFT SLO degradation tolerance. We use 14s, corresponding to the TTFT degradation tolerance our b2b-saas operating range approaches at saturation; the filter's shipped default is 18s. Workloads with stricter SLOs should use proportionally smaller T_max. - Do not transplant τ values (or
peakPrefillThroughputvalues) across deployments without re-measuring.
Discussion
The framework reduces a multi-dimensional tuning problem (which scorers, which weights, which thresholds) to a one-step decision (which bottleneck), with all other parameters either fixed by the matched configuration or derivable from a single calibration measurement. This works on the three workloads evaluated here. The natural follow-up is to validate the framework on a broader range of traffic shapes.
The inference-perf workload catalog provides standardized workload generators covering a range of prompt/output distributions, multi-turn structures, and prefix-reuse patterns beyond the three we evaluated. We would prioritize:
- Tool-use / agentic workloads: many short turns with moderate per-turn prompts, growing context. Tests whether the prefill-bound matched configuration remains correct when per-turn prompt growth shifts the bottleneck between regimes within a single conversation. Partially addressed since these experiments: the agentic-serving guide now ships the prefill-bound matched configuration (token-load routing with offload-aware cache accounting and a calibrated
peakPrefillThroughput) for agentic code-generation workloads on H200 and TPU v7, including P/D-disaggregated variants, with published benchmark results; a systematic study of regime shift within single conversations remains open. - Multimodal serving: image-plus-text traffic adds a stage the two-regime taxonomy does not cover: a vision encoder that runs ahead of prefill and can saturate independently. Addressed since these experiments: the multimodal-serving guides now ship these matched configurations applied per scheduling profile: encode routes on queue depth, every profile that performs prefill (including colocated prefill+decode) uses the affinity-filter + token-load stack, and pure decode scores on active requests alone. Benchmarks against a round-robin baseline on a shared-prefix multimodal workload (8 model servers, 2×H200 each at TP=2) are published with the guide. Multimodal also stresses an assumption behind the token-load signal: image inputs carry no text length, so per-request token counts come from the multimodal
token-producer, which estimates each image's contribution from its resolution, count-calibrated against the served model. Two of this post's constants had to move for multimodal:affinityThresholddrops from 0.8 to 0.6, because a multimodal prompt's cacheable fraction tops out near 0.7 (the image and question portions are never cache hits) so the 0.8 default can never engage; andmaxTTFTPenaltyMsdoubles from the 18s default to 36s, because the calibration that producespeakPrefillThroughput(measured 15751 for Qwen3-VL-32B on H200/TP=2) exercises text prefill only: vision-encoder time makes image-heavy prefill slower per estimated token than the measured throughput implies, so the filter's predicted TTFT runs light of wall-clock. In this post's terms the effective τ doubles for image-heavy traffic; the doubled gate is benchmark-validated to parity with the previously shipped weighted blend. - Long-output summarization: moderate-prompt, very-long-output workloads. Tests whether the decode-bound matched configuration holds when output token diversity (versus reasoning's concentrated chain-of-thought style) changes decode batching dynamics.
- Mixed-traffic scenarios: simultaneous code-gen-style and chat-style traffic on the same cluster. Tests whether per-route configuration selection is necessary or whether a single configuration can serve heterogeneous traffic adequately.
- High-prefix-reuse production traces: real chat-completion traffic where prefix-reuse rates are high but the corpus is unbounded (unlike b2b-saas's fixed 150-prompt corpus). Validates whether the matched configuration holds under realistic cache-management dynamics, or whether b2b-saas-style pathologies don't appear in practice.
Prefill/decode-disaggregated deployments deserve a note of their own: they are the limiting case of the framework. When prefill and decode run in separate pools, the two regimes stop being workload properties the operator must identify and become structural properties of each pool: every request exercises both bottlenecks, one pool at a time. The llm-d P/D guides (pd-disaggregation and the P/D variants of agentic-serving) accordingly ship both matched configurations simultaneously: the prefill profile routes with the affinity-filter + token-load stack (with its own calibrated peakPrefillThroughput), and the pure-decode profile scores on active requests alone. The multimodal e-p-d configuration extends the same pattern to three pools, with encode routing on queue depth. In these deployments the one decision the framework asks of the operator (which bottleneck) is answered by the architecture itself; what remains is per-pool calibration.
A secondary follow-up: characterizing the latency-predictor pipeline on high-variance production traffic where the bottleneck shifts dynamically. Our three benchmark workloads each sit in a single regime; production traffic often does not. The latency-predictor pipeline's per-request TTFT estimation may give it a structural advantage in such settings, outperforming any single matched configuration that's optimal for one regime but suboptimal for another, but we have not measured this. Reducing the pipeline's setup overhead (predictor training, sidecar deployment, model serving) would also lower the cost of deploying it as a workload-agnostic default; the current filter's ttftSource: latencyPredictor mode already removes the configuration-surface part of that overhead, though the predictor sidecars still need to be deployed and trained.
A tertiary follow-up has shipped since these experiments were run: the configuration matrix distributed with the router records measured peakPrefillThroughput values for the (model, accelerator, engine) combinations llm-d supports, so operators on those paths don't need to run the calibration step themselves. The formula is portable; the constants are not, and the matrix is how the constants now travel.
Appendix
Configmaps
Full scheduler configmaps for all five configurations: llm-d-benchmarking/configmaps
Workload YAMLs
Full workload specifications: llm-d-benchmarking/workloads
Full Result Tables
Per-workload result tables and analysis scripts live in the analysis/ subdirectory of each workload: llm-d-benchmarking/workloads